

In short
- Track five core metrics: delivery success rate, latency, error rate, retry rate, and duplicate rate.
- Structure your logs with event IDs, timestamps, and outcomes, not full payloads.
- Set alert thresholds that separate real problems from noise.
- Webhook failures rarely announce themselves. Visibility is how you catch them before customers do.
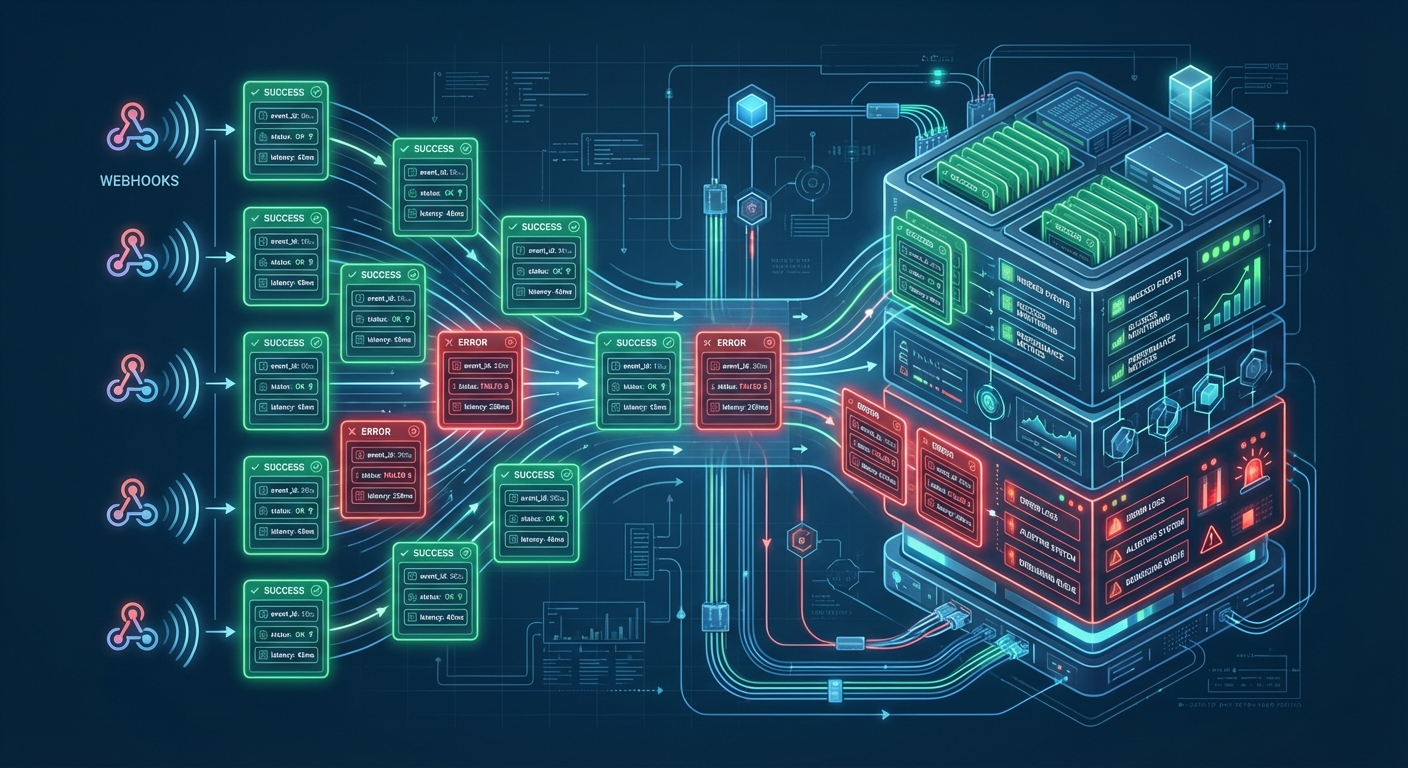
Why webhook monitoring is harder than normal API monitoring
Your API sits behind a load balancer. You know when it's down. Webhooks are different.
A webhook failure can happen silently. Your endpoint might be timing out. Your retry logic might be stuck in a loop. A duplicate event might be processing twice. Meanwhile, metrics that look fine tell you nothing is wrong.
The problem isn't missing data. It's that most teams monitor the wrong metrics. They watch HTTP status codes (did the endpoint respond?) but miss why responses are slow. They log errors but not the context. They set alerts so sensitive they cry wolf every hour, or so loose they miss real problems.
This article cuts through that. Here's the checklist that catches 80% of webhook issues before they hit your customers.

1. The Five Core Metrics You Must Monitor
If you monitor five numbers consistently, you'll know the health of your webhook system.
Delivery Success Rate (%)
This is your north star. It's the percentage of webhook events that reached your endpoint and got a 2xx response.
A successful delivery means your endpoint received the request, processed it, and told us it succeeded. A failed delivery means something broke: network timeout, HTTP 500, bad DNS, your service was down, whatever.
You want this above 95%. If it drops below 95% for more than a few minutes, wake someone up. At 90%, you're already losing 10% of user-critical events.
How to measure: Count events where (http_status >= 200 AND http_status < 300) divided by total_events sent.
What it looks like in action: Your order webhook usually delivers 99% successfully. At 3:47 AM it drops to 82%. Your customer's payment processing is silently failing. That 17-point drop is the difference between "normal night" and "wake up the on-call engineer."
Latency (P50, P95, P99)
How fast do your endpoints respond? Track percentiles, not averages. A 200ms average tells you nothing if half your requests take 50ms and half take 1.5 seconds.
P95 latency is your best signal. It's "95% of requests finished in X time, 5% took longer." If your P95 latency is 5 seconds, one in twenty requests is slow enough to worry about.
You want P95 under 5 seconds. If it creeps above 10 seconds, something's wrong: your endpoint is underpowered, a database query is slow, or the customer's infrastructure is under load.
How to measure: Record the timestamp when you send the webhook, record when you get the response, calculate the delta. At the end of each 5-minute window, compute the 95th percentile across all requests.
What it looks like in action: Latency has been steady at 280ms P95 for weeks. Suddenly it jumps to 6 seconds. Your customer just deployed a new payment gateway that queues webhook processing. Their system still works, but it's slow now. You caught it before they complained.
Error Rate (% of failed requests)
Out of all requests you send, what percentage come back as non-2xx?
This is different from delivery success rate. Success rate is "did we get ANY 2xx response?" Error rate is "how many requests failed?" A 500 error, a 503 timeout, a 400 bad request. They all count.
You want error rate under 5%. If it's above 10%, your customer's endpoint is broken or rejecting your requests.
How to measure: Count requests where (http_status < 200 OR http_status >= 300) divided by total_requests.
What it looks like in action: Error rate jumps from 1% to 18%. Check the status codes: 80% of them are 503 Service Unavailable. Your customer's payment processor is down. You know within minutes, not hours.
Retry Rate (% of events requiring retry)
On the first attempt to deliver a webhook, how many fail and need to be retried?
High retry rates tell you there's systemic friction. Network timeouts. DNS failures. Endpoints that temporarily go down. When retry rate jumps, you've got a clue that something upstream is struggling.
You want retry rate under 10%. If it's above 15%, investigate. Something is broken, not just slow.
How to measure: Count events where (initial_delivery_failed == true) divided by total_events.
What it looks like in action: Retry rate is normally 3%. Suddenly it's 22%. What happened? Trace the logs: 60% of failures are timeout exceptions. Your customer's datacenter had a network blip. Their engineers are probably already fixing it, but you have real-time visibility into the problem's impact.
Deduplication Hit Rate (% of duplicates received)
Every webhook can be resent. It's an "at-least-once" delivery model. The provider might retry. Your system might retry. The same event can arrive twice.
Your customer's code should be idempotent (safe to process the same event twice). But you want to know how often duplicates are hitting your endpoint. A sudden spike in duplicates tells you something is wrong: maybe a retry loop, maybe the provider is stuck in a retry cycle, maybe your customer's endpoint is timing out and triggering cascading retries.
You want duplicate rate under 5% for steady state. If it jumps to 20%, dig in.
How to measure: Track idempotency keys (unique event IDs). When you see the same key twice in a time window, count it as a duplicate. Calculate duplicates divided by total events.
What it looks like in action: Duplicate rate has been 2% for months. Today it hits 8%. Check the logs: the same 400 events are being replayed by your provider for the last 6 hours. Their system has a bug or is retrying aggressively. You know it and can escalate to their team.
2. Structured Logging: What to Capture
Logs without structure are noise. JSON logs with consistent fields are searchable, debuggable, and machine-readable.
Here's the exact schema I recommend:
{
  "event_id": "evt_1a2b3c4d",
  "event_type": "order.created",
  "received_at": "2026-03-03T14:22:10.456Z",
  "endpoint_url": "https://api.example.com/webhooks/orders",
  "http_status": 200,
  "latency_ms": 234,
  "signature_valid": true,
  "idempotency_key": "order_12345",
  "retry_count": 0,
  "processing_outcome": "success"
}
Every single webhook log should have these nine fields. They tell the complete story: what event, where it went, whether it succeeded, how long it took, and what retry cycle it's on.
Fields that matter
event_id, event_type, idempotency_key: These let you trace a specific event through your system. If a customer says "order 12345 processed twice," you search by idempotency_key and find both deliveries instantly.
received_at, latency_ms: Timestamps + duration let you spot slow deliveries and correlate with your customer's infrastructure changes. "Latency spiked at 3:47 AM" maps back to their deployment or an outage.
http_status, processing_outcome: Status codes tell you what happened (timeout, 500 error, etc.). Outcome tells you whether it mattered (success, failed, ignored, deduplicated).
retry_count: Critical for debugging. If you see a log with retry_count=5, you know this event has already failed four times. It's the difference between a fluke and a pattern.
Sanitization: Don't log PII
Never log customer API keys, auth tokens, passwords, or personally identifiable information. Strip them. Truncate them. Redact them.
Instead of logging the full webhook payload, log the size of the payload and the field count. Example:
{
  "payload_size_bytes": 4120,
  "payload_field_count": 18,
  "payload_hash": "sha256_abc123"
}
If you need the actual payload for debugging, store it separately in a secure, access-controlled system. Log a pointer to it ("payload stored as delivery_id_abc123"). Never in the main logs.
Optional fields (add as your system scales)
- correlation_id: Trace this event as it flows through multiple systems. Your service sends it to a queue, which sends it to a processor, which hits the endpoint. One correlation ID ties all those logs together.
- customer_id: When everything breaks, you can instantly see which customers are affected.
- region: If you have multi-region endpoints, know which region failed.
- user_agent: Track which version of the webhook client is hitting you. "All failures are from client v1.2.0, we're on v2.1.0." Instant diagnosis.
3. Alert Thresholds: Make It Human-Readable
Alerts without thresholds are guesses. Thresholds without context are noise.
Here's the exact framework I use. Three tiers: critical (page the on-call engineer), warning (Slack notification), and informational (log only).

Tier 1: Critical (Page On-Call)
These are user-visible outages. Wake someone up.
| Condition | Threshold | Duration | Why |
|---|---|---|---|
| Delivery success rate < 95% | Last 5 minutes | Immediate | 5% of events failing is a major outage. |
| P95 latency > 15 seconds | Sustained 3+ min | Page after 3 min | Cascading timeouts. Customer workflows are stuck. |
| Error rate > 10% | Last 100 requests | Immediate | More than 1 in 10 requests is failing. |
Tier 2: Warning (Slack Alert, Don't Page)
Something's degrading. Check it in the morning. Fix it today.
| Condition | Threshold | Duration |
|---|---|---|
| Delivery success 90–95% | Last 30 min | Trending downward. You'll hit critical soon if it continues. |
| P95 latency 5–15 sec | Sustained 5+ min | Slow but not broken yet. |
| Error rate 5–10% | Last 100 requests | Partial failures. Some requests work, some don't. |
| Retry rate > 15% | Last 1 hour | Something is causing initial failures. |
Tier 3: Informational (Log Only, No Alert)
Data points. Monitor trends but don't create alerts.
- Duplicate rate > 5%
- Average latency trending up 50ms day-over-day
- Error rate is 3% (normal but tracked)
4. Implementation: Where to Send Logs
You have three paths. Pick the one that fits your operations maturity.
Datadog, Splunk, or Sumo Logic (Managed)
Pros: Built-in dashboards, alert rules, retention policies. Someone else runs the infrastructure.
Cons: $$$ (10–50 cents per GB of logs). Vendor lock-in. You're shipping data off-premise.
Setup: Configure your webhook system to ship JSON logs via HTTPS to their API endpoint. Create dashboards in their UI. Set alert rules (when delivery_success < 95%, send PagerDuty alert).
ELK Stack or Grafana (Self-Hosted)
Pros: Free software. Full control. Logs stay on your infrastructure.
Cons: Operational overhead. You run Elasticsearch (memory hungry), Logstash (processing), Kibana (visualization). You patch them, upgrade them, tune them.
Setup: Ship logs to Logstash via syslog or HTTP. Logstash parses them into Elasticsearch. Kibana visualizes. Prometheus + Grafana for metrics and alerting.
DIY (SQLite, PostgreSQL, Time-Series DB)
Pros: Minimal dependencies. Full customization.
Cons: You build everything. Dashboards? Build them. Alerting? Write a cron job that queries the database and sends Slack messages.
Setup: Log to a table. Write SQL queries for metrics. Query every 5 minutes via cron. Alert when thresholds breach.
Most teams start with a managed solution (Datadog) because it's operational immediately. As they grow, they move to self-hosted for cost.
5. Debugging Common Issues with Monitoring
Monitoring is only useful if you know how to read it.
"Delivery Success Dropped Overnight"
Your delivery rate was 98%, now it's 82%. What happened?
- Check retry rate. Is it spiking? If yes: network issue or timeout. Your endpoint is unreachable or slow.
- Check error rate. Is it high? If yes: your customer's endpoint code broke. They're returning 500s.
- Check latency. Did it jump? If yes: they're under load or their infra changed.
Example action: You see retry rate 35%, error rate 3%, latency normal. Diagnosis: timeouts. Their endpoint is slow or down temporarily. Check their status page or call them.
"We're Getting Duplicate Events"
Retry rate is 20%, duplicate rate is 18%. Are these duplicates normal or a problem?
- Check if retry rate and duplicate rate move together. If both jump from 3% to 18%, it's normal retry behavior. Their endpoint is failing, so they're getting retried, so duplicates increase.
- Check if duplicate rate stays high even when retry rate drops. If yes: their system is stuck replaying old events or a background job is retransmitting.
Example action: Retry rate dropped back to 3% but duplicate rate is still 8%. Check their logs. Are they reprocessing events from yesterday? Yes. They redeployed and ran a replay job. That's intentional. All good.
"Webhooks Are Slow But Uptime Looks Fine"
Delivery success is 99%. Error rate is 1%. But P95 latency is 22 seconds. That's weird.
- Break down latency by endpoint. Which customer's endpoint is slow?
- Break down latency by event type. Is it all order events or just payment events?
- Check their logs. Are they processing async? Queuing to another system?
Example action: P95 latency is 22 sec. Break down by endpoint: one customer's endpoint is consistently 18 sec, the rest are 200ms. Call that customer. They're processing webhooks in a queue that's backed up. They need to scale their workers.
6. Hookwing's Built-In Observability
Monitoring webhooks shouldn't require setting up Datadog and writing custom SQL.
Hookwing gives you observability out of the box.
Real-time dashboard shows you delivery success rate, latency distribution, error rate, and retry breakdown. You don't set it up. It's just there. Click on a failing delivery and see exactly why it failed: "Endpoint returned 503 Service Unavailable at 14:22:10, we'll retry in 30 seconds."
Per-endpoint metrics. When delivery success drops, you instantly see which customer's endpoint is broken. Is it one customer or all of them?
Transparent replay. Replay a failed event and watch in real-time as it's delivered again. See the exact response. See exactly what failed.
Access logs. Every webhook, every delivery attempt, full audit trail. Timestamp, event type, status code, latency, outcome. Searchable. Filterable.
Why it matters: You don't have to build observability. You focus on understanding your customers' events. We handle the monitoring.
Recap: The Five-Minute Checklist
Use this before you go to production with webhooks.
- ☐Delivery success rate > 95%?
- ☐Latency P95 < 5 seconds?
- ☐Error rate < 5%?
- ☐Retry rate < 10%?
- ☐Duplicate detection enabled?
- ☐Logs structured (event_id, status, latency, outcome)?
- ☐Alerts configured (Tier 1 critical, Tier 2 warning)?
- ☐Dashboard up (can you see trends)?
---
Ready to ship webhooks with confidence?
Hookwing's built-in observability makes monitoring effortless. See every delivery in real-time. Understand failures before users do.